Interactive globe in R
I’m addicted to spatial visualizations; I think they really put data sets into perspective, as if each data point has its place. In this tutorial I’m going to teach you how to create a very cool 3D interactive globe with threejs.
Introduction
Our goal will be to visualize Japan’s commerce with arcs on a 3D earth. The source data set we’ll be using (Japan Trade Statistics by Tadashi Nagao) is a really good example of what you’ll find in the wild: the data only talks about countries (with their names recorded in a non-standard way) and has absolutely no information about their coordinates.
To create the visualization there are 3 steps: getting the coordinates of the capital of each country, converting the country names to a more standard form and creating the globe itself.
Getting the coordinates
Our first task is importing the data.
I loaded the table with Japan’s trade information, loaded the table with the country/country-code relationship, and then joined the two into a trades data frame. I also converted the column names to lower case, selected only the relevant variables, and grouped the table by country (adding up the values of all trades with each country). None of this is shown here because it is too data set-specific, but this was the result:
After this initial setup, we can move on to getting the actual coordinates of the capital of each country with the maps package (we’re going to use the coordinates of the capitals as the landing points for the arcs on the 3D globe). Here I’ll load the world.cities data set and select the names of the countries, their capitals, and their coordinates.
# Get coordinates of every capital
capitals <- world.cities %>%
  filter(capital == 1) %>%
  transmute(
    country_name = country.etc,
    lat = lat,
    long = long
  ) %>%
  rbind(c("Hong Kong", 22.39, 114.1))
Note: Let’s not get caught up in geopolitics, but I added Hong Kong manually because it apparently is/isn’t part of China, so it isn’t in the world.cities data set…
This is what capitals looks like:
Converting country names
Take a look at how “American Samoa” and “United Arab Emirates” are spelled in the two tables above (that’s the main reason why I included them). They are not formatted in the same way.
I’ll spare you the details, but this is the most difficult task you’ll face when dealing with spatial data: names are a pain. The two tables we have to work with encode the country names in very different ways, so we need to standardize those.
We’ll do this with the countrycodes package, more specifically the countrycode_data data set, which contains a column of regex statements to match almost any way you could write the name of each country. First I clean just a little bit the names in trades\$country_name, but then it’s as straight forward as this:
# Get the regex statement for each country
regex <- countrycode::countrycode_data$country.name.en.regex
# Get a correspondence between country names in 'totals' and
# 'capitals'
trades_capitals <- as_tibble(cbind(
  regex,
  trades_countries = match_country(regex, trades$country_name),
  capitals_countries = match_country(regex, capitals$country_name)
))
On the snippet above I’m omitting the match_country function, which simply matches each entry in regex with an entry of the second argument, but the overall code is pretty simple! And now we have a table that connects the names in trades with the names in capitals, which we can use to join the two other tables into a new one called geo_trades.
Creating the globe
To create the arcs in the globe we need a table in a very special format. It has to contain 4 columns: origin_lat, origin_long, dest_lat, and dest_long which will be the starting and ending points for each arc in the globe.
I’ll use geo_trades to create a new table called arcs (our table will also have the value of the trades between the two points, but we’ll exclude this column when passing the table to the globe-generating function). This is how I created arcs:
# Create origins and destinations for arcs (origin is always Tokyo)
arcs <- geo_trades %>%
cbind(
origin_lat = 35.68,
origin_long = 139.69
) %>%
select(-country_name) %>%
transmute(
origin_lat = origin_lat,
origin_long = origin_long,
dest_lat = lat,
dest_long = long,
value = value
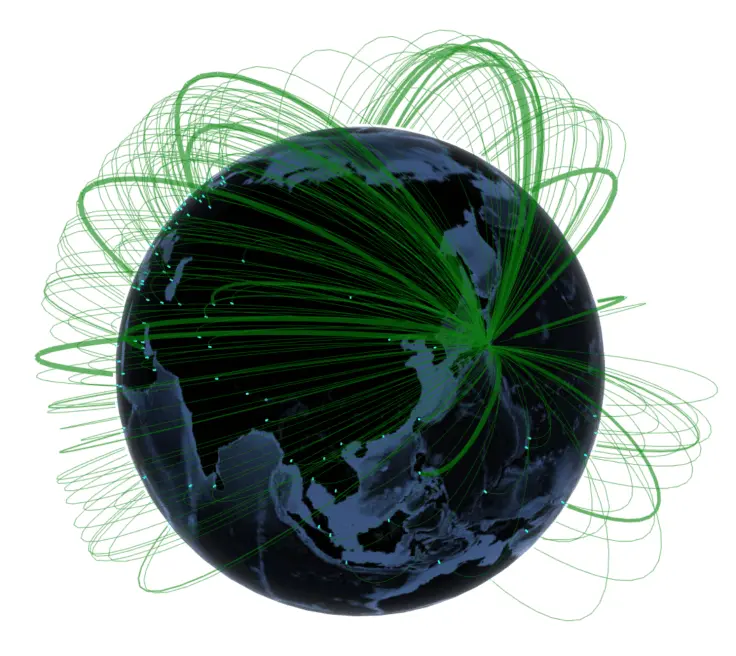
)And now for the grand finale: this is the function we use to actually generate the globe 😁 If you look closely at the image below, you can see that the thickness of each line represents the total monetary value of the trades between Japan and each country.
earth <- system.file("images/world.jpg",  package = "threejs")
# Create globe
globejs(
  img = earth, lat = arcs$dest_lat, long = arcs$dest_long,
  arcs = arcs[, 1:4], arcsOpacity = 0.6, arcsHeight = 0.8,
  arcsLwd = arcs$value, arcsColor = "green", atmosphere = TRUE,
  height = 800, width = 800, bg = "white", value = 4
)
And if you want to interact with the globe, please head over to my Kaggle kernel where the HTML works better.